
The short answer: A one-star review wave on a mid-ticket Amazon product costs somewhere between a few thousand dollars and the listing itself, and the bill arrives in four separate envelopes: returns, lost conversion, lost ranking, and account-health damage. A pre-shipment inspection costs $149, flat. The rest of this article is the arithmetic behind both numbers, with every source named, and a worked model you can fill in with your own figures. Where a number is an assumption instead of a measurement, it is labeled as one.
1. The situation
You sell a $25 product on Amazon. The listing has a few hundred reviews, a 4.6 average, and it does 300 units a month. Your supplier ships a 1,000-unit replenishment batch, and this batch is bad: a cosmetic defect rate the AQL table would have failed, or one functional flaw in a corner of the sample nobody opened.
Nothing happens at first. That is the dangerous part. The batch clears inbound receiving, goes live, and sells for two to three weeks. Then the reviews land, in a cluster, all saying versions of the same thing. The listing's average slides through a rounding threshold. Conversion dips. Amazon's algorithm notices the dip before you do. By the time you are reading the one-star reviews with your own eyes, you are not at the start of the problem. You are a month into it.
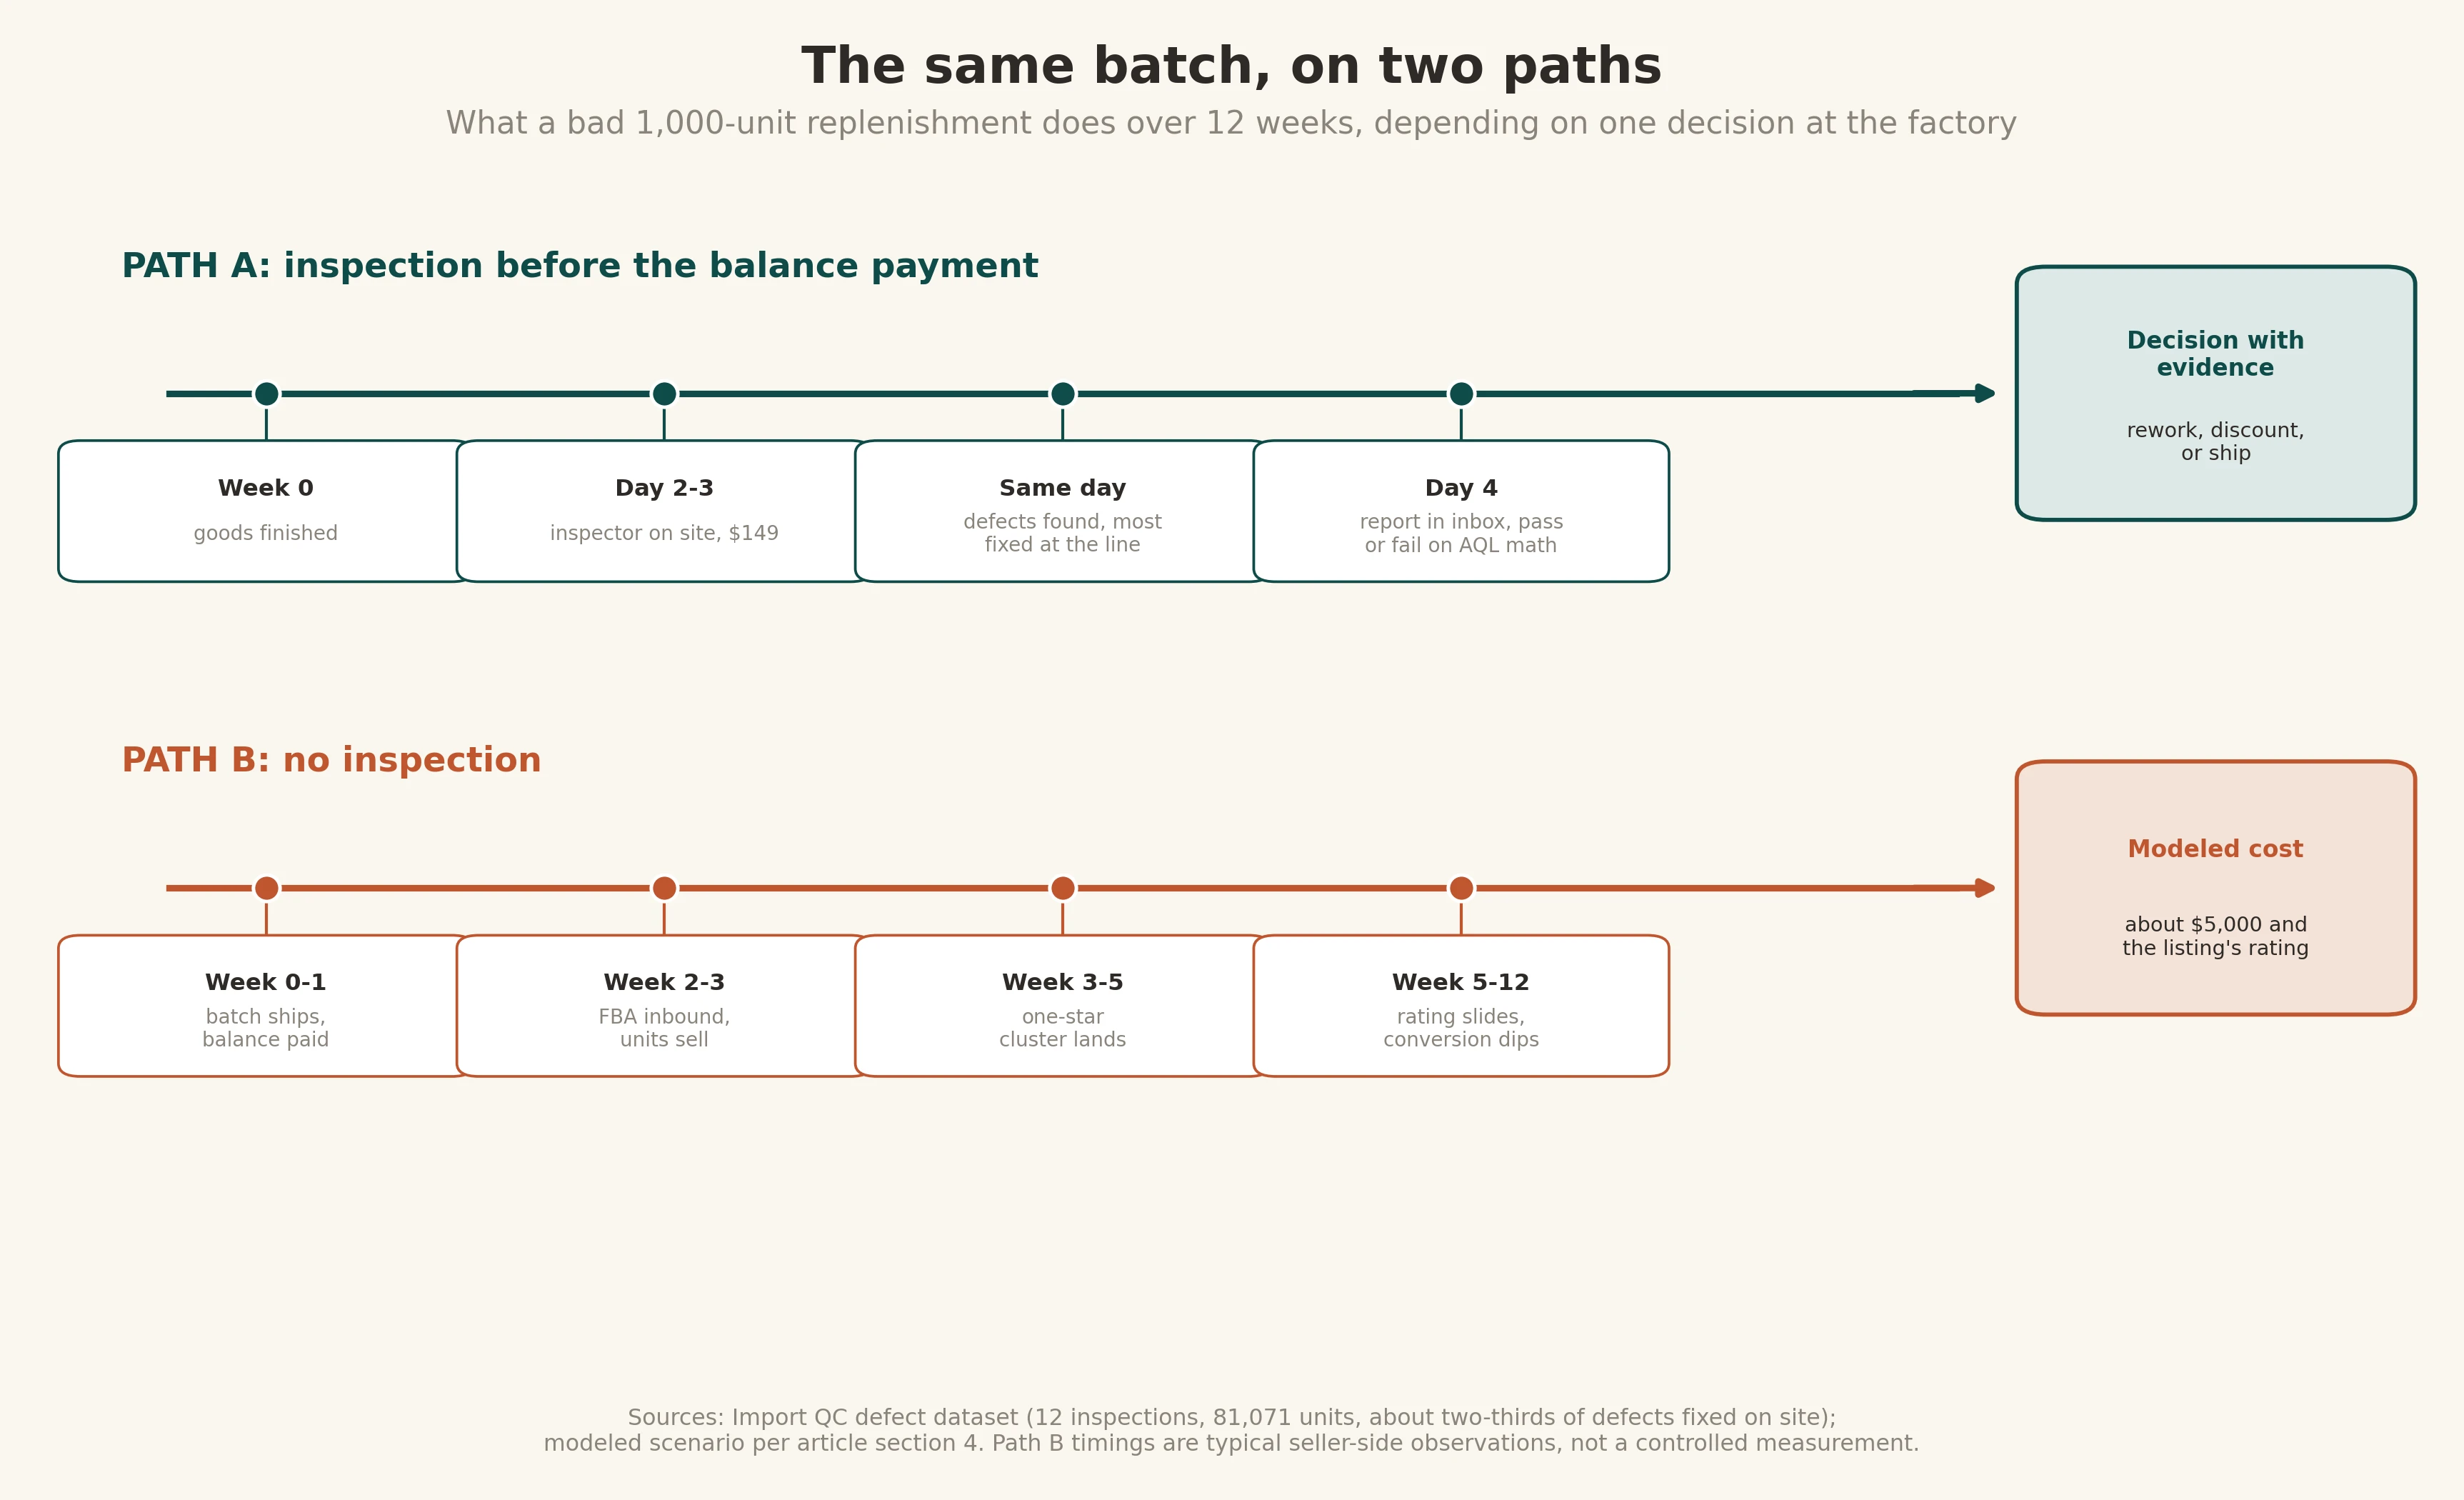
Figure 1. The same batch on two paths. The top path is the one this article prices.
This article prices that sequence, and then prices the alternative.
2. What ratings do to revenue: the measured record
Three research results carry the weight here. Two of them were measured on restaurants, and one on e-commerce, and the difference matters, so let us be precise about which is which.
Luca (2016), Harvard Business School working paper, "Reviews, Reputation, and Revenue: The Case of Yelp.com." Using Seattle restaurant data matched to revenue records, Luca found that a one-star increase in Yelp rating leads to a 5 to 9 percent increase in revenue, with the effect driven by independent restaurants, not chains. The paper is one of the most cited in the platform-economics literature (about 1,800 citations). Read it as what it is: a measurement of restaurants on Yelp. The reason it appears in an article about Amazon is analogy: the mechanism (a displayed average that shoppers use as a quality shortcut) is the same mechanism. The 5 to 9 percent figure itself is not an Amazon number, and anyone quoting it to you as one is overselling.
Anderson and Magruder (2012), The Economic Journal. A regression-discontinuity design on Yelp's rounding rules: because Yelp displays rounded half-stars, two restaurants with nearly identical true ratings can display different ones. An extra displayed half-star caused restaurants to sell out 19 percentage points (49%) more frequently during peak times. The finding that transfers to Amazon is the rounding, not the 19 points: displayed ratings jump at thresholds, so the difference between a 4.24 and a 4.26 true average can be the difference between a displayed 4.0 and 4.5. Amazon's star display rounds the same way. A review wave does not have to drag you down a full star to hurt you. It has to drag you across one rounding line.
Spiegel Research Center at Northwestern, with PowerReviews (2017), "How Online Reviews Influence Sales." This one was measured on e-commerce: purchase data from online retailers across product categories. Three findings. First, a product displaying five reviews shows about 270% greater purchase likelihood than the same product with none, and the lift is front-loaded in the first handful of reviews. Second, the effect scales with price: displaying reviews raised conversion about 190% for a lower-priced product and 380% for a higher-priced one. Third, purchase likelihood peaks when the displayed rating sits between 4.0 and 4.7, then declines as it approaches a perfect 5.0, because flawless reads as manufactured.
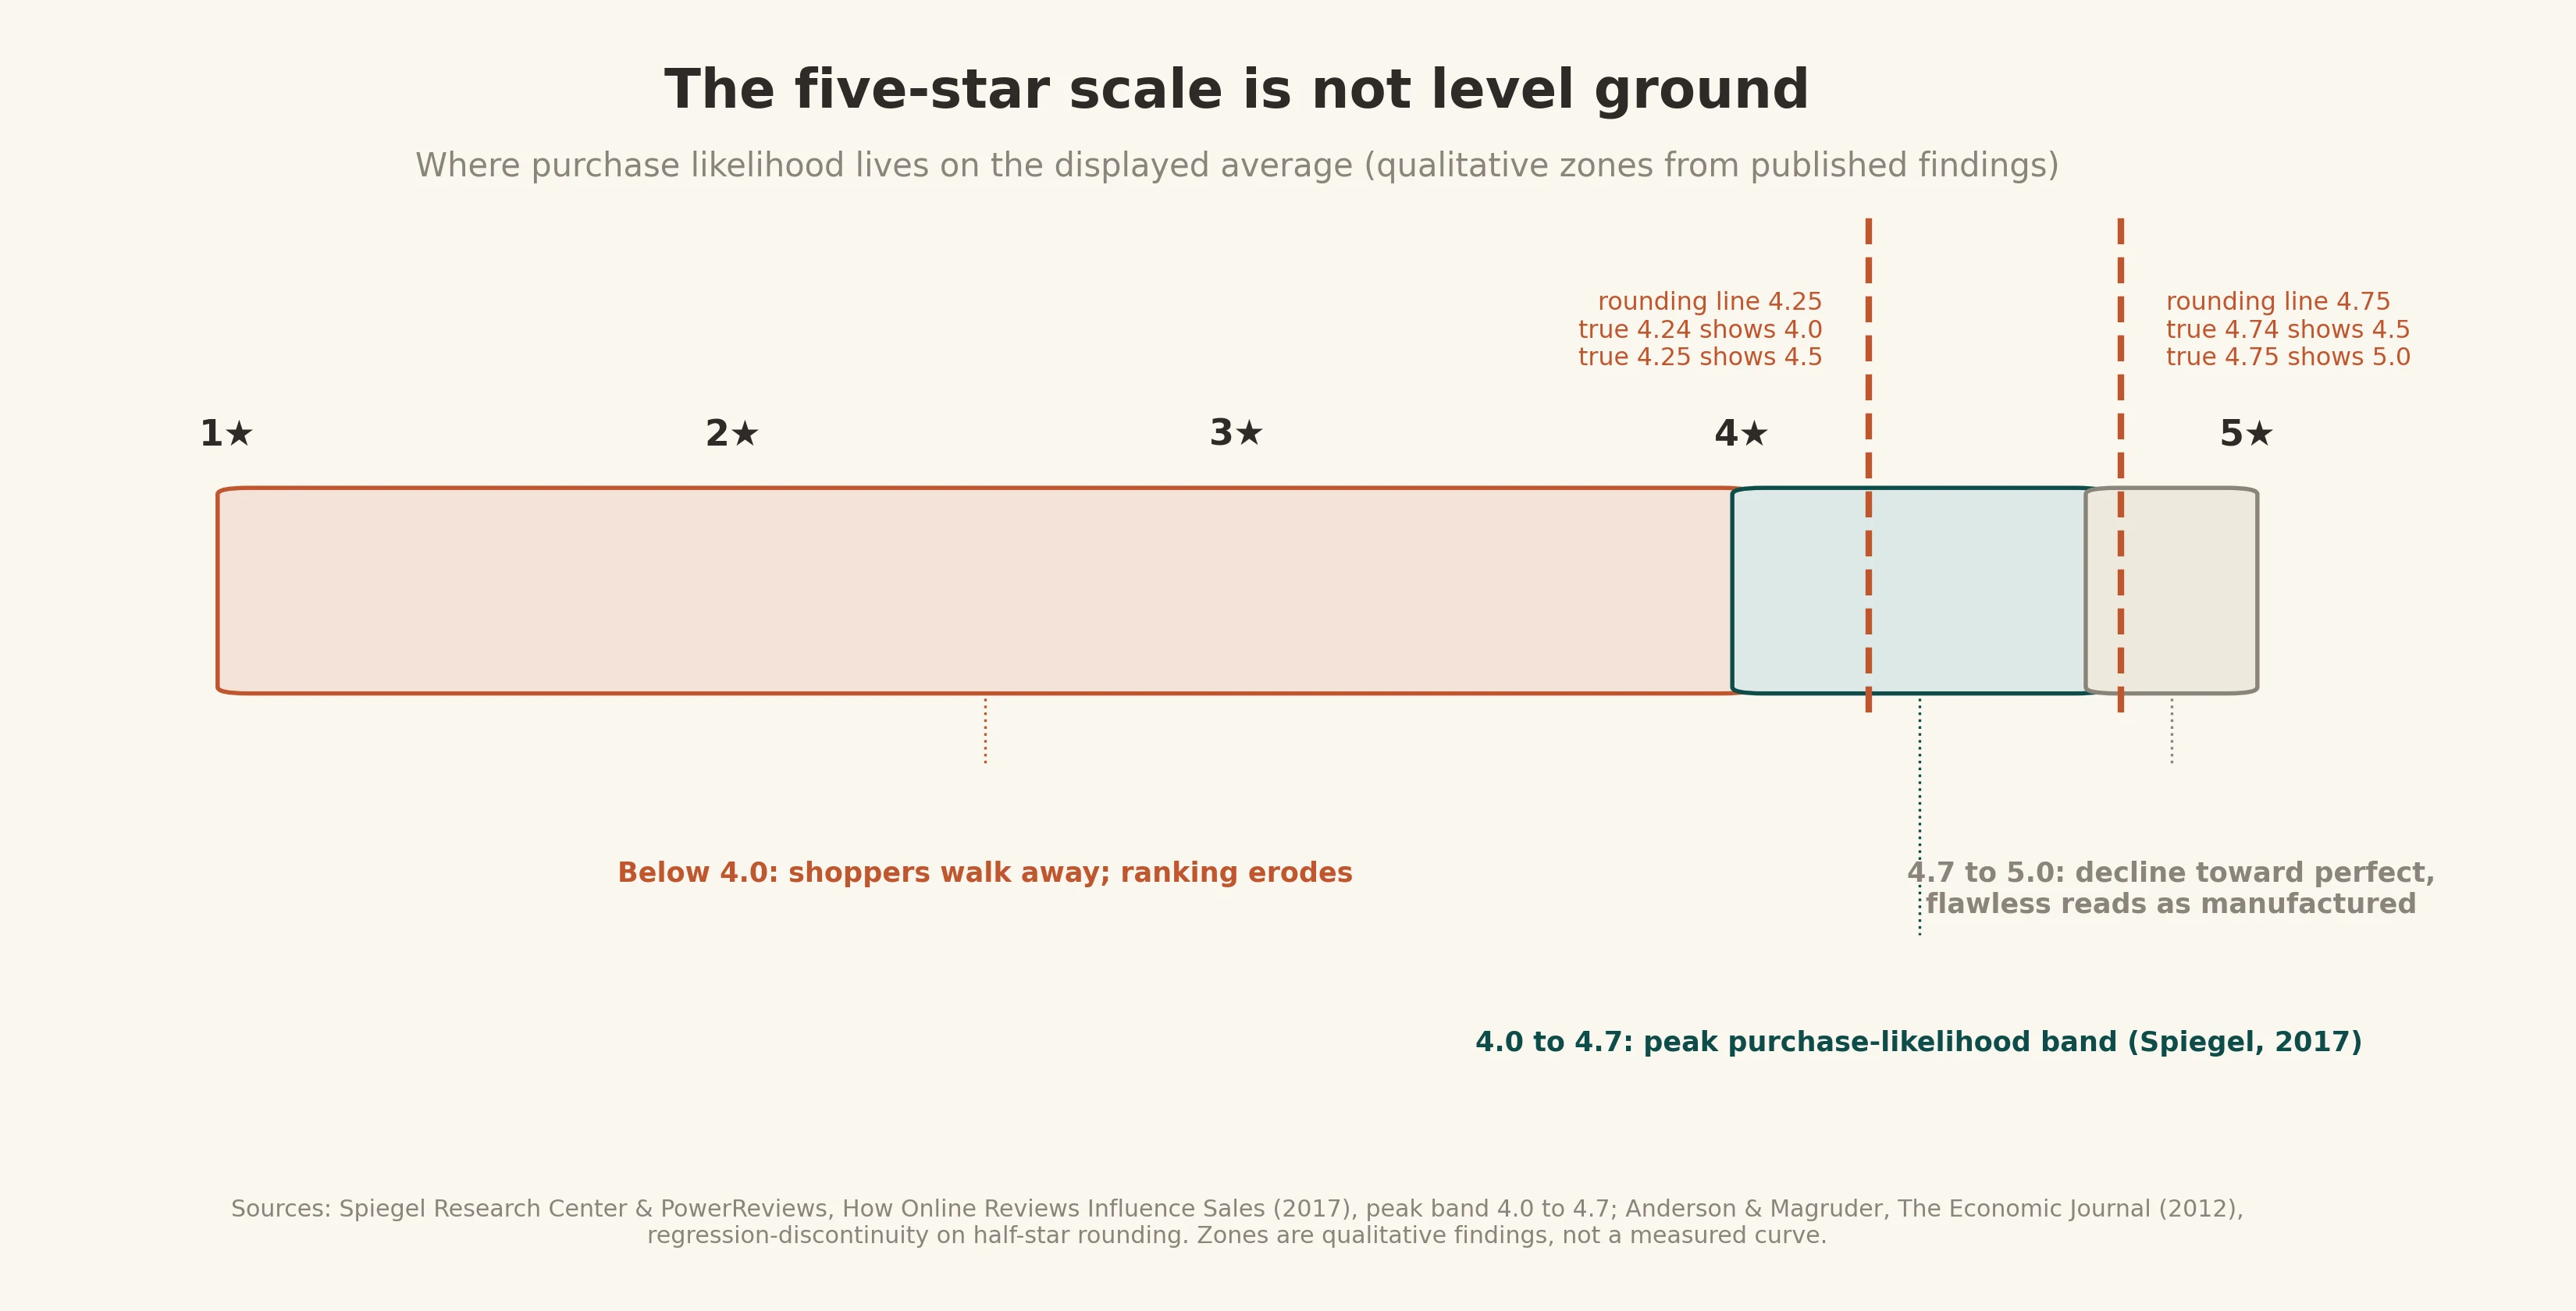
Figure 2. The five-star scale is not linear ground. Purchase likelihood peaks in the 4.0 to 4.7 band and declines toward a perfect 5.0 (Spiegel, 2017); displayed averages jump at rounding thresholds, so small true drops can cost a full displayed half-star (Anderson & Magruder, 2012). Zone boundaries are qualitative findings, not measured curves.
Hold the third finding carefully, because it cuts in both directions. The peak band is where your listing lives when things are going well. A review wave is what knocks you out of it, down through the rounding thresholds into the 3-something range, where the Spiegel curve says shoppers walk away and the Luca analogy says the revenue effect runs in reverse. Nobody has published a clean causal measurement of "revenue lost per half-star dropped on Amazon," and this article will not pretend otherwise. But the direction is not in doubt, and the magnitudes above are the honest anchors.
Then there is the platform itself. Amazon's Seller Central policy sets the Order Defect Rate target at under 1% of orders, with warnings and deactivation risk above it. Negative feedback is a direct ODR input. A review wave and an account-health problem are the same event seen from two dashboards.
One more mechanic, and it is the reason a small wave punches above its weight. Amazon does not show reviews chronologically, and the displayed star average is not a lifetime average: the ranking of reviews favors recent, detailed, verified-purchase reviews with helpful votes, and the rating calculation itself weights recent reviews more heavily (practitioner-documented mechanics; Amazon does not publish the formula). A listing with 400 old five-star reviews and 20 fresh one-star reviews displays closer to the ones than the lifetime arithmetic suggests, and the "top reviews" panel is where a tight cluster of same-theme defect reviews, all marked helpful by shoppers, takes up residence. Twenty bad reviews in three weeks do not dilute into your history. They become your storefront.
3. What the wave is made of: defects that write reviews
Reviews do not invent themselves. A one-star review wave is a defect distribution that reached customers, and its composition is predictable, because it is the same composition inspectors count on the factory floor.
From our own defect dataset (twelve pre-shipment inspections, 81,071 units, 141 defective units in the samples, aggregated in "The anatomy of a failed inspection"):
Cosmetic defects write the most reviews. Scratches, dirty marks, untrimmed threads, print flaws: the majority of findings across our reports, seven of twelve explicitly. Customers photograph these. "Arrived scratched" is the most reproducible one-star text in e-commerce, and it is the cheapest defect class to create (handling, dusty workshops, rushed packing) and the cheapest to fix when someone is watching. Two-thirds of the defective units in our dataset were fixed during the inspection itself, which is to say: two-thirds of a potential review wave was deleted before it existed.
Functional defects write the worst reviews. They are rare in the dataset and disproportionate in damage. The foot-spa inspection found water inside units during function testing. Had that batch shipped, the reviews would not have said "minor cosmetic issue." They would have said "leaks," "stopped working," possibly "unsafe," and "unsafe" is the word that turns a review wave into an account-health case.
Spec mismatches write the angriest reviews, because the customer feels deceived rather than unlucky. The electric-blanket inspection (September 2026, in the sample reports library) recorded that the fitted power cord, model ML-T330, did not match the product model GL-BL14. The squishy-toy order that failed in July 2026 had retail cartons containing the wrong product designs. "Not as described" is both a review text and a return reason, and ICSC's 2024 returns research puts "item not as expected" at 42% of stated return reasons and damaged items at 52%.
This is the part a competitor's blog post cannot copy, so let it be plain: every defect row in an inspection report is a review that has not been written yet. The report is the wave, read early, at $1 to $10 on the 1-10-100 cost curve instead of $100.
4. The cost stack, line by line
Price the wave in four envelopes. The figures below are a modeled scenario, stated as assumptions you can swap for your own; the structure is the deliverable.
Scenario: $24.99 price, 300 units/month baseline velocity, 1,000-unit replenishment batch, a 5% escaped defect rate (a lot that would have failed AQL major 2.5 by a wide margin), listing at 4.6 stars with a few hundred reviews.
Envelope 1: returns. Fifty defective units reach customers (5% of 1,000). Assume half come back as returns (assumption; your own rate is in Seller Central). Each costs the refund impact plus processing: industry estimates put per-return handling at $10 to $65 once shipping, labor, and restocking are counted. Call it $25 to $40 per return all-in for a $25 item. Envelope 1: roughly $700 to $1,000.
Envelope 2: lost conversion. Assume the wave moves the displayed average across one rounding threshold (4.6 to 4.2 true, displayed 4.5 to 4.0) and trims relative conversion by 10 to 20% while the bad reviews sit on page one (assumption, anchored to the Spiegel peak-band finding and the Luca magnitude by analogy, not measured on Amazon). On $7,500/month of baseline revenue, that is $750 to $1,500 per month, for the two to four months a review cluster typically dominates the "top reviews" panel. Envelope 2: roughly $2,000 to $5,000.
Envelope 3: lost ranking and the recovery tax. Conversion is a ranking input. When conversion dips, organic placement softens, and sellers typically respond with PPC spend and price reductions to hold velocity (practitioner mechanics, not a published coefficient). Call the recovery tax $500 to $1,500 in extra ad spend and margin given up over the recovery quarter. Envelope 3: $500 to $1,500.
Envelope 4: account health and inventory. ODR pressure toward the 1% line, possible listing suppression, and, in the bad version, a removal or disposal order on the remaining FBA stock at per-unit fees Amazon sets each year. This envelope is zero in the lucky scenario and five figures in the unlucky one. Price it as a probability, not an expectation: maybe 5 to 10% of bad-batch events land here (assumption).
Add the envelopes with midpoints: $850 + $3,500 + $1,000, plus the tail risk. Call it $5,350 for the ordinary version of the wave, on a product doing $90,000 a year. The inspection that would have caught the batch at the factory: $149.
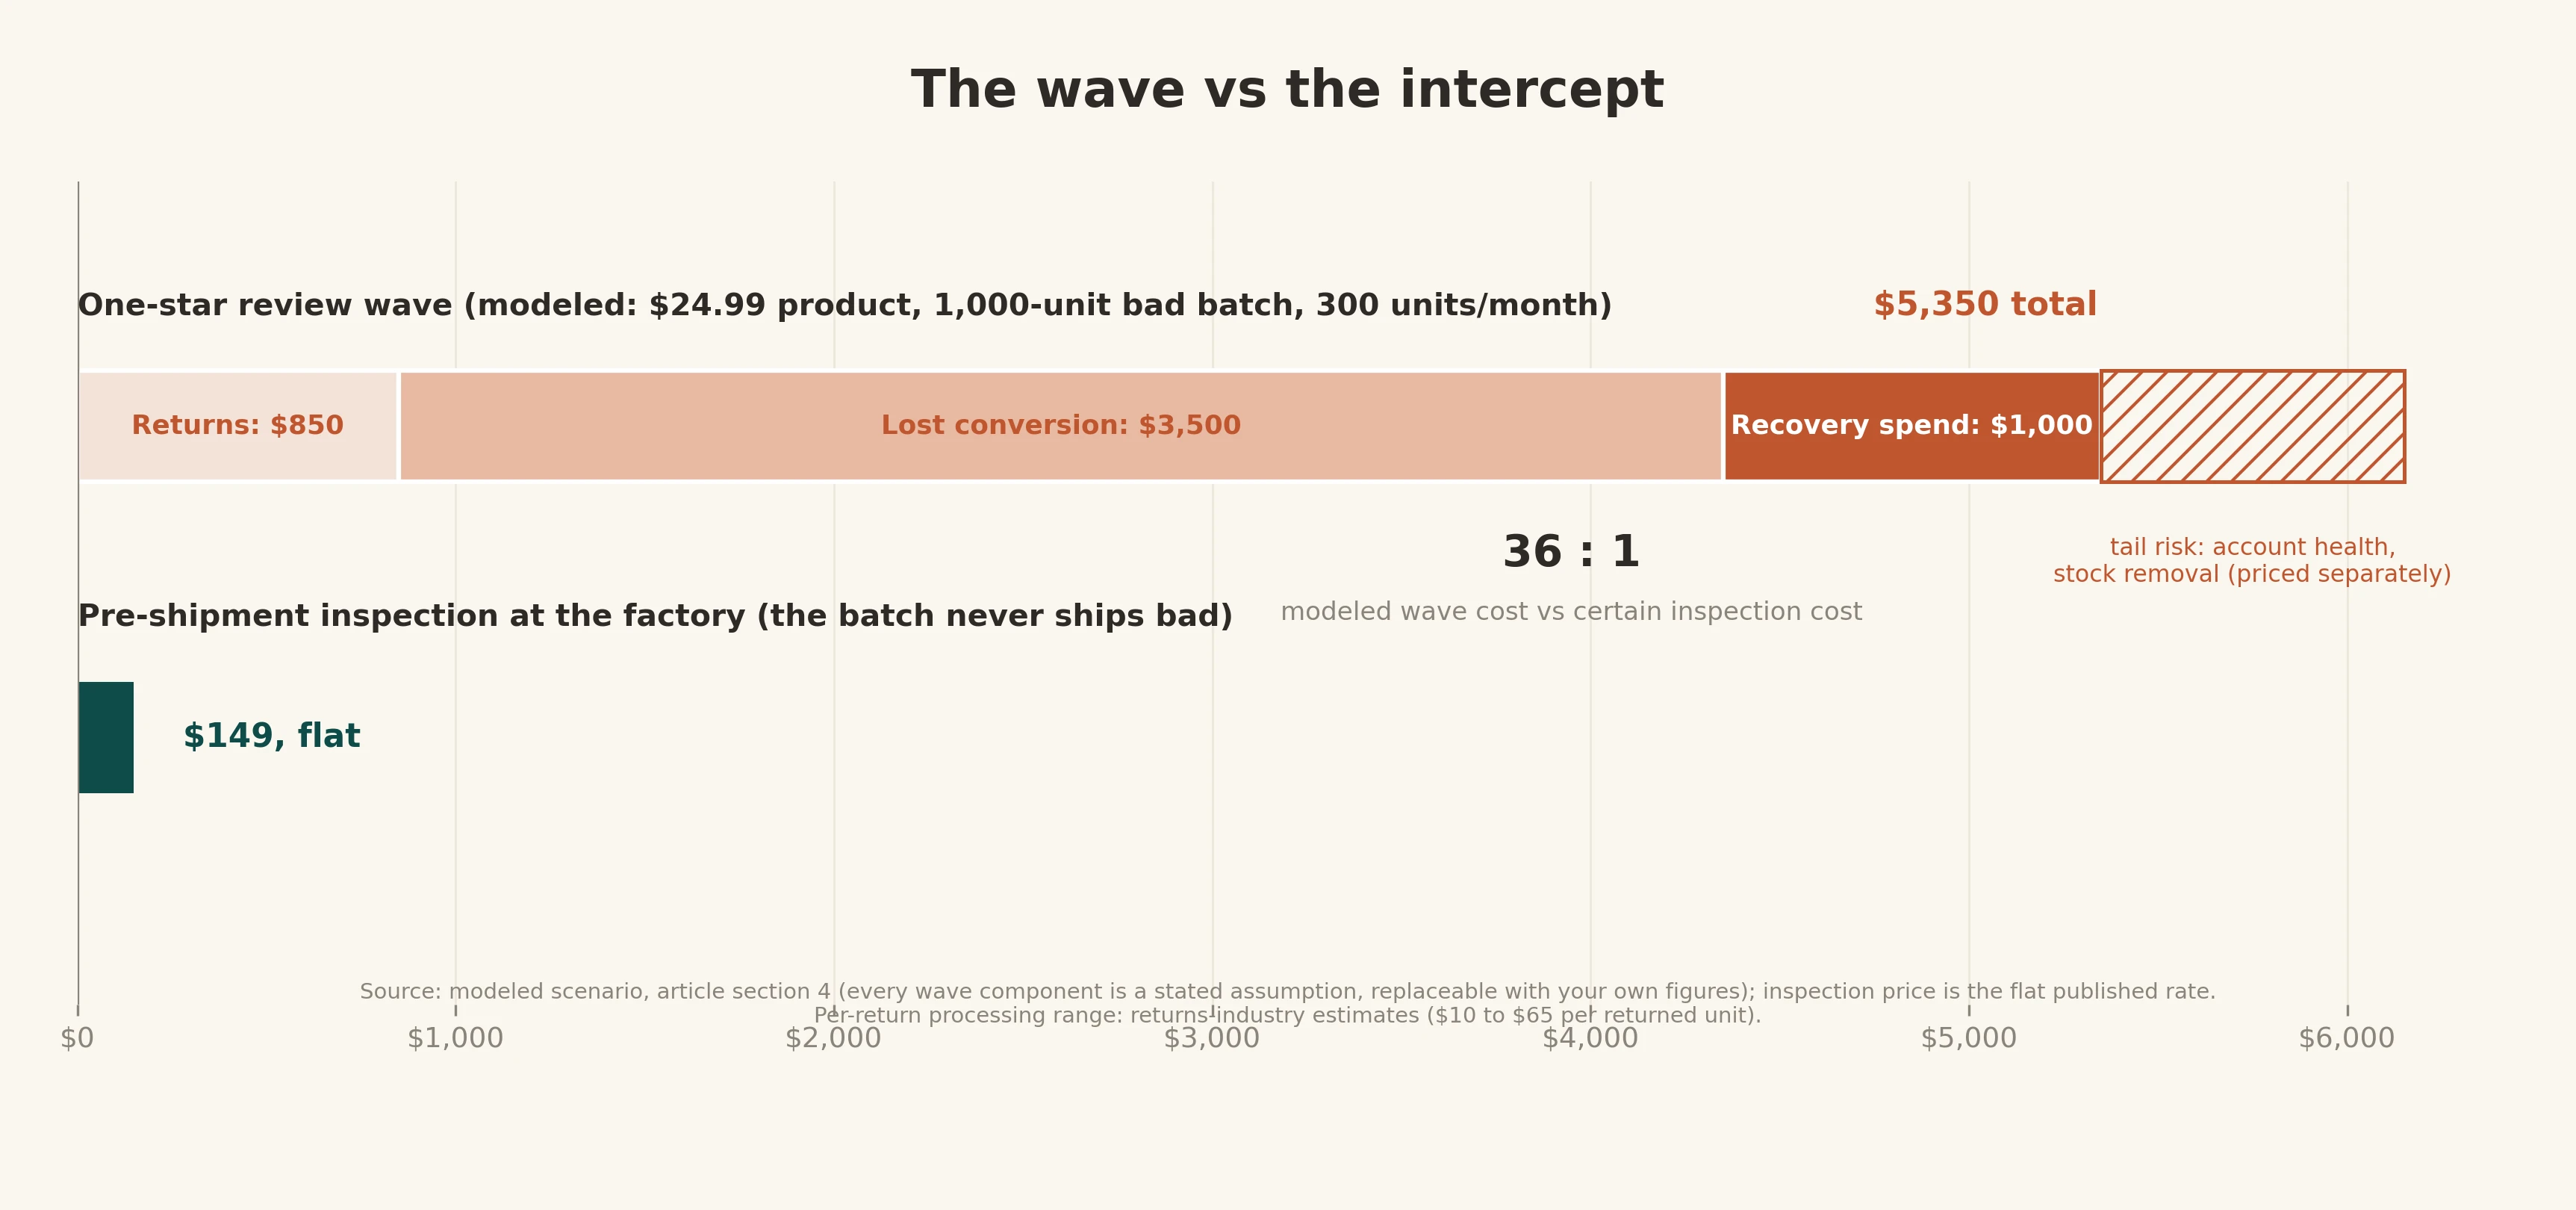
Figure 3. The modeled scenario above, stacked, against the flat price of the inspection that intercepts it. Every component of the stack is an assumption you can replace with your own numbers; the inspection bar is not one. Scenario assumptions in section 4, the DIY model in section 6, full sources at the end.
The ratio in that scenario is about 36 to 1. It is not a universal constant. It moves with your price, your velocity, and how far the rating slides. Section 6 gives you the model to compute your own.
5. The fair comparison: what the $149 is being weighed against
One asymmetry is worth naming, because sellers get it wrong in both directions. The inspection is a certain, small, upfront cost. The wave is a probabilistic, large, delayed cost. Humans discount delayed probabilistic costs, which is why the inspection feels optional at purchase time and indispensable in retrospect.
But do not overcorrect into magical thinking. A PSI is a filter with a published strength, not insurance: at AQL 2.5 on a 1,000-unit lot, the sample is 80 units, and a passing result is statistically consistent with a major-defect rate near 2.5% still reaching customers. On 1,000 units, that is up to about 25 defective units. Some of those write reviews. The honest claim, then: inspection caps the defect rate that reaches your customers at a level you chose, documents it, and fixes most of what it finds on site. A capped wave is a rounding error in your reviews. An uncapped one is a listing event.
6. The model: compute your own number
Five inputs, one evening, no spreadsheet wizardry.
- Monthly revenue at stake. Price × baseline units/month. (Scenario: $7,500.)
- Conversion haircut. Pick 10%, 20%, or 30% depending on how far you believe the rating slides. The Spiegel band and the Luca magnitude are the anchors; your category's review density is the context. Multiply input 1 by this, times the months the cluster sits on top (2 to 4).
- Return bill. Escaped defectives (batch size × escaped rate) × your return propensity × your all-in per-return cost.
- Recovery tax. Extra PPC and price reductions over the recovery quarter. If you have never run one, use $500 to $1,500 as a placeholder and refine after your first one.
- Tail probability. A number between 0 and 1 for "this goes to account health / stock removal." Multiply by the cost of that event for you (remaining FBA units × removal or disposal fees, plus whatever a suppressed listing costs per week).
Sum 2 through 5. Compare with $149, or with your annual inspection budget if you inspect every batch (batch frequency times the flat man-day rate). The output is your ratio. If your ratio is under 2, skip the inspection on that SKU and accept the risk with open eyes. If it is over 10, the inspection is not a cost line, it is a rounding error with a report attached.
7. When the review math does not apply
Fairness, because not every reader sells on Amazon:
- B2B and wholesale. Your buyer is a business with its own QC expectations; there is no public star rating to slide. The wave mechanism is absent. (The returns and dispute mechanics remain, priced in "The anatomy of a failed inspection.")
- Offline and marketplace-free channels. Same logic: the cost stack loses envelopes 2 and 3.
- Commodity components. If your product is an input to someone else's product, reviews are not your risk surface.
- And one Amazon case: a mature listing with thousands of reviews absorbs a small cluster without crossing a rounding line. The wave math bites hardest on young listings (few hundred reviews, rating near a threshold) and on high-ticket items, where Spiegel measured the largest conversion sensitivity (380% lift from reviews at the higher-priced retailer, which means the same sensitivity in reverse).
Notice what survives in every case: the defect still costs money. The wave is the Amazon-shaped version of the cost. Returns, chargebacks, and disputes are the universal version.
8. Where the inspection method ends
The honest limits, because this article's credibility is worth more than a booking:
- It cannot fix the product. If the design is wrong (the listing photos overpromise, the sizing runs small), reviews will say so, and no inspection prevents it. Inspection verifies conformity to your spec, not the wisdom of your spec.
- It cannot remove reviews that exist. A wave from a previous bad batch is a recovery problem (section 6, envelope 3), not an inspection problem.
- It is a sample. Section 5 has the arithmetic. It caps risk; it does not zero it.
- It happens before shipment. That is the entire point, but it means the inspection cannot help the batch already sitting in an FBA warehouse. If that is your situation, your options are removal orders, price, and time.
- Not every wave is a quality event. Carrier damage, listing inaccuracy, and review manipulation by competitors exist. Inspection addresses the first of those partially (packaging and carton tests) and the other two not at all.
- You cannot buy your way out of a wave. The shortcut has a price tag now. The FTC's Rule on the Use of Consumer Reviews and Testimonials (16 CFR Part 465, effective October 21, 2024) bans buying or creating fake reviews, suppressing negative ones, and undisclosed insider reviews, with civil penalties up to $53,088 per violation, and each fake review can count as its own violation. Amazon terminates accounts for it as well. The legitimate recovery tools are slower: requesting removal only for reviews about fulfillment issues, Vine for new listings, price and PPC patience, and time. Which is the whole argument of this article from the other side: once the wave exists, your options are expensive or illegal. Before it exists, one of your options costs $149.
FAQ
What share of buyers leave reviews? Seller-side estimates put organic review rates in the low single digits of orders, and lower for satisfied buyers than for angry ones. Treat that as a practitioner range, not a published measurement, and get your real number from your own listings. The asymmetry is the point: defectives review at several times the baseline rate, which is why a 5% escaped defect rate does not produce 5% bad reviews. It produces a cluster.
Can I inspect the goods after they reach Amazon? No, and this is the most expensive misunderstanding in FBA. Prep centers and warehouses handle and forward; they do not open 80 units and run function tests. The inspection has to happen where rework is free: the factory floor, before the balance payment.
Will a failed inspection report help me with Amazon or with the supplier? With the supplier, yes: a third-party FAIL report is the document that turns "please fix" into a rework agreement, a discount, or a refund, because it is evidence the factory cannot talk around. With Amazon, indirectly: the report is not a Seller Central artifact, but the batch it stopped never generates the ODR event.
Should I aim for a 5.0 average? No. Spiegel's purchase-likelihood curve peaks at 4.0 to 4.7 and declines toward 5.0; a spotless listing reads as curated. Aim to stay in the band and off the rounding lines below it.
My listing is big. Does a wave still matter? Less, and the arithmetic in section 6 will tell you how much less. Thousands of reviews dilute a cluster. The cases that hurt mature listings are functional or safety defects (the word "unsafe" in reviews) and ODR events, both of which are scale-independent.
How many defective units justify an inspection? The question inverts the logic. You inspect because you do not know how many defective units there are. The cheapest time to learn the defect rate of a batch is before you own it.
Sources
- Luca, M. (2016). Reviews, Reputation, and Revenue: The Case of Yelp.com. Harvard Business School NOM Working Paper 12-016. (One-star increase → 5 to 9% revenue increase; independent restaurants; effect measured on restaurants, applied to marketplaces by analogy.)
- Anderson, M., & Magruder, J. (2012). Learning from the Crowd: Regression Discontinuity Estimates of the Effects of an Online Review Database. The Economic Journal, 122(563), 957-989. (Displayed half-star increase → sell out 19 percentage points, 49%, more frequently at peak; rating-rounding discontinuities.)
- Spiegel Research Center, Northwestern University, with PowerReviews (2017). How Online Reviews Influence Sales. (Five reviews vs none → about 270% greater purchase likelihood; 190% / 380% conversion lift for lower- vs higher-priced products; purchase likelihood peaks at 4.0-4.7 stars; verified-buyer badge about +15%.)
- Amazon Seller Central, Account Health / Order Defect Rate policy: ODR target under 1% of orders; warnings and deactivation risk above.
- National Retail Federation & Happy Returns, 2025 Retail Returns Landscape, October 2025: $849.9 billion returned, 15.8% of retail sales, 19.3% of online sales.
- ICSC, 2024 returns research: leading online return reasons, damaged items 52%, item not as expected 42%.
- Industry per-return processing cost estimates ($10 to $65 per returned unit), returns-industry reporting (Optoro, Radial).
- The 1-10-100 rule of quality costs, quality-management literature.
- FTC, Trade Regulation Rule on the Use of Consumer Reviews and Testimonials, 16 CFR Part 465 (effective October 21, 2024): bans fake, bought, suppressed, and undisclosed insider reviews; civil penalties up to $53,088 per violation (January 2025 inflation adjustment, unchanged for 2026), each fake review countable separately.
- Import QC sample reports library (identities withheld): IQC-20260902-BLANKET (power-cord model mismatch, September 2026); foot-spa function-test water finding.
- Import QC defect dataset: twelve inspections, 81,071 units, 141 defective units in samples, roughly two-thirds corrected on site, including the failed 50,000-unit toy order (IQC-20260726-TOY, July 26, 2026).
Third-party inspection in China at $149 per man-day, flat, dispatched within 48 to 72 hours, photo-documented report within 24 hours. That is the entire price of the right-hand column in Figure 3. The sample reports library shows the document you get, free to read before you book.
Related reading: The anatomy of a failed inspection · Pre-shipment inspection checklist: what inspectors check, line by line · How much does a quality inspection in China cost? (2026)
Figure 3 assumptions (repeated for the image's sake): $24.99 price, 300 units/month, 1,000-unit batch, 5% escaped defect rate, 50% return propensity on defectives, $25 to $40 all-in per return, 10 to 20% relative conversion haircut for 2 to 4 months, $500 to $1,500 recovery spend, tail risk priced separately. All scenario numbers are assumptions for the model, not measurements.